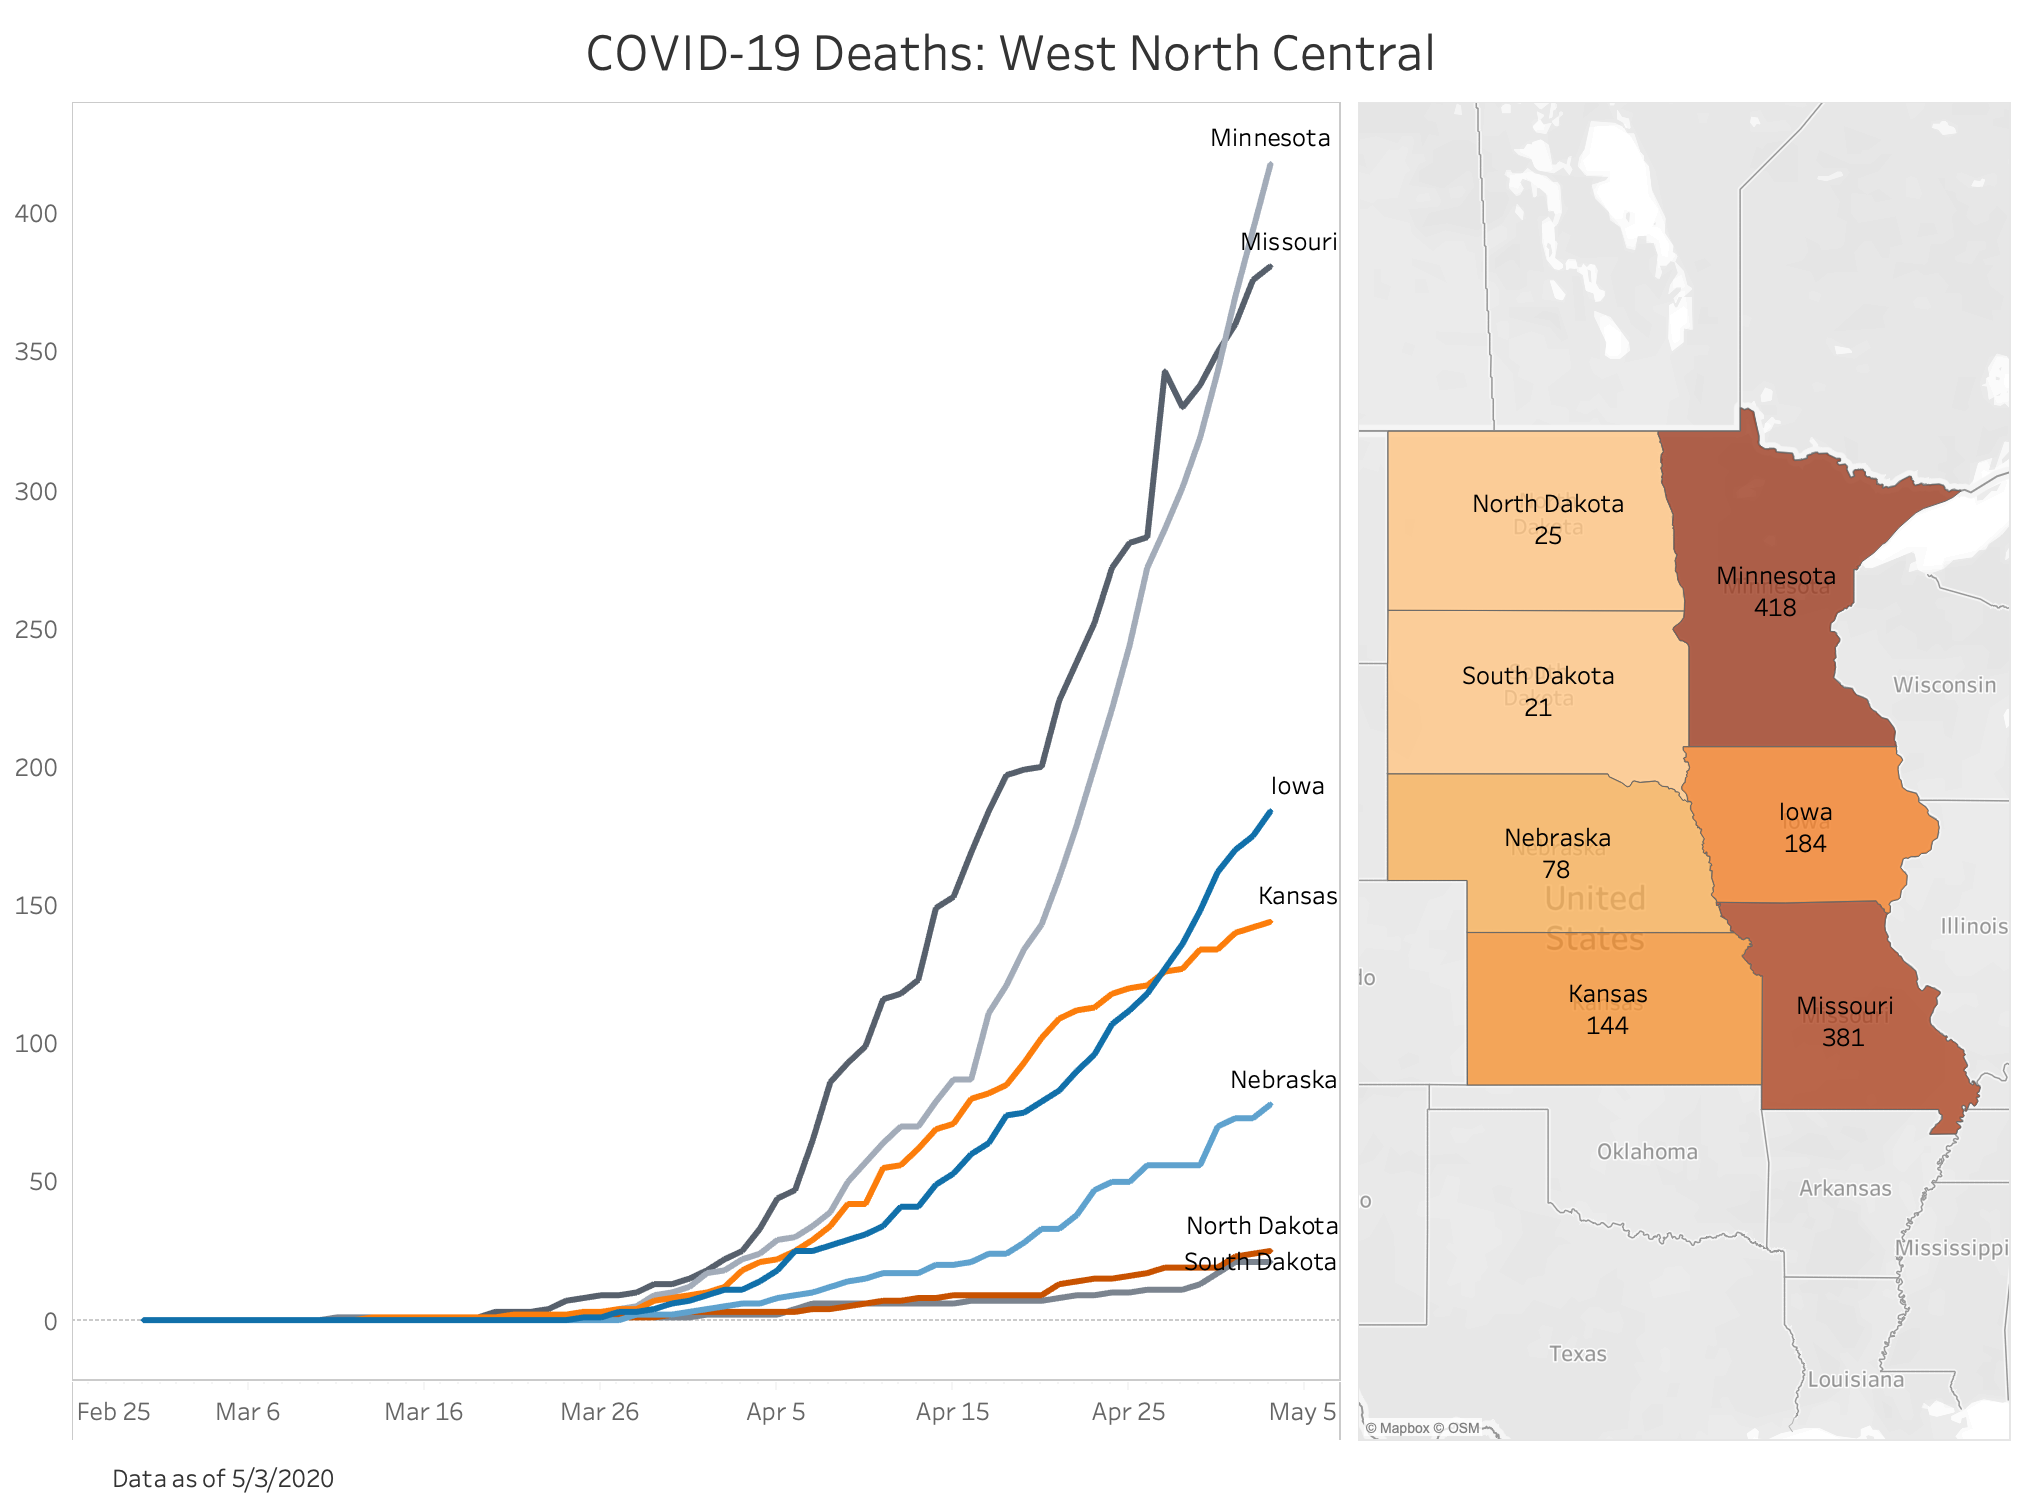
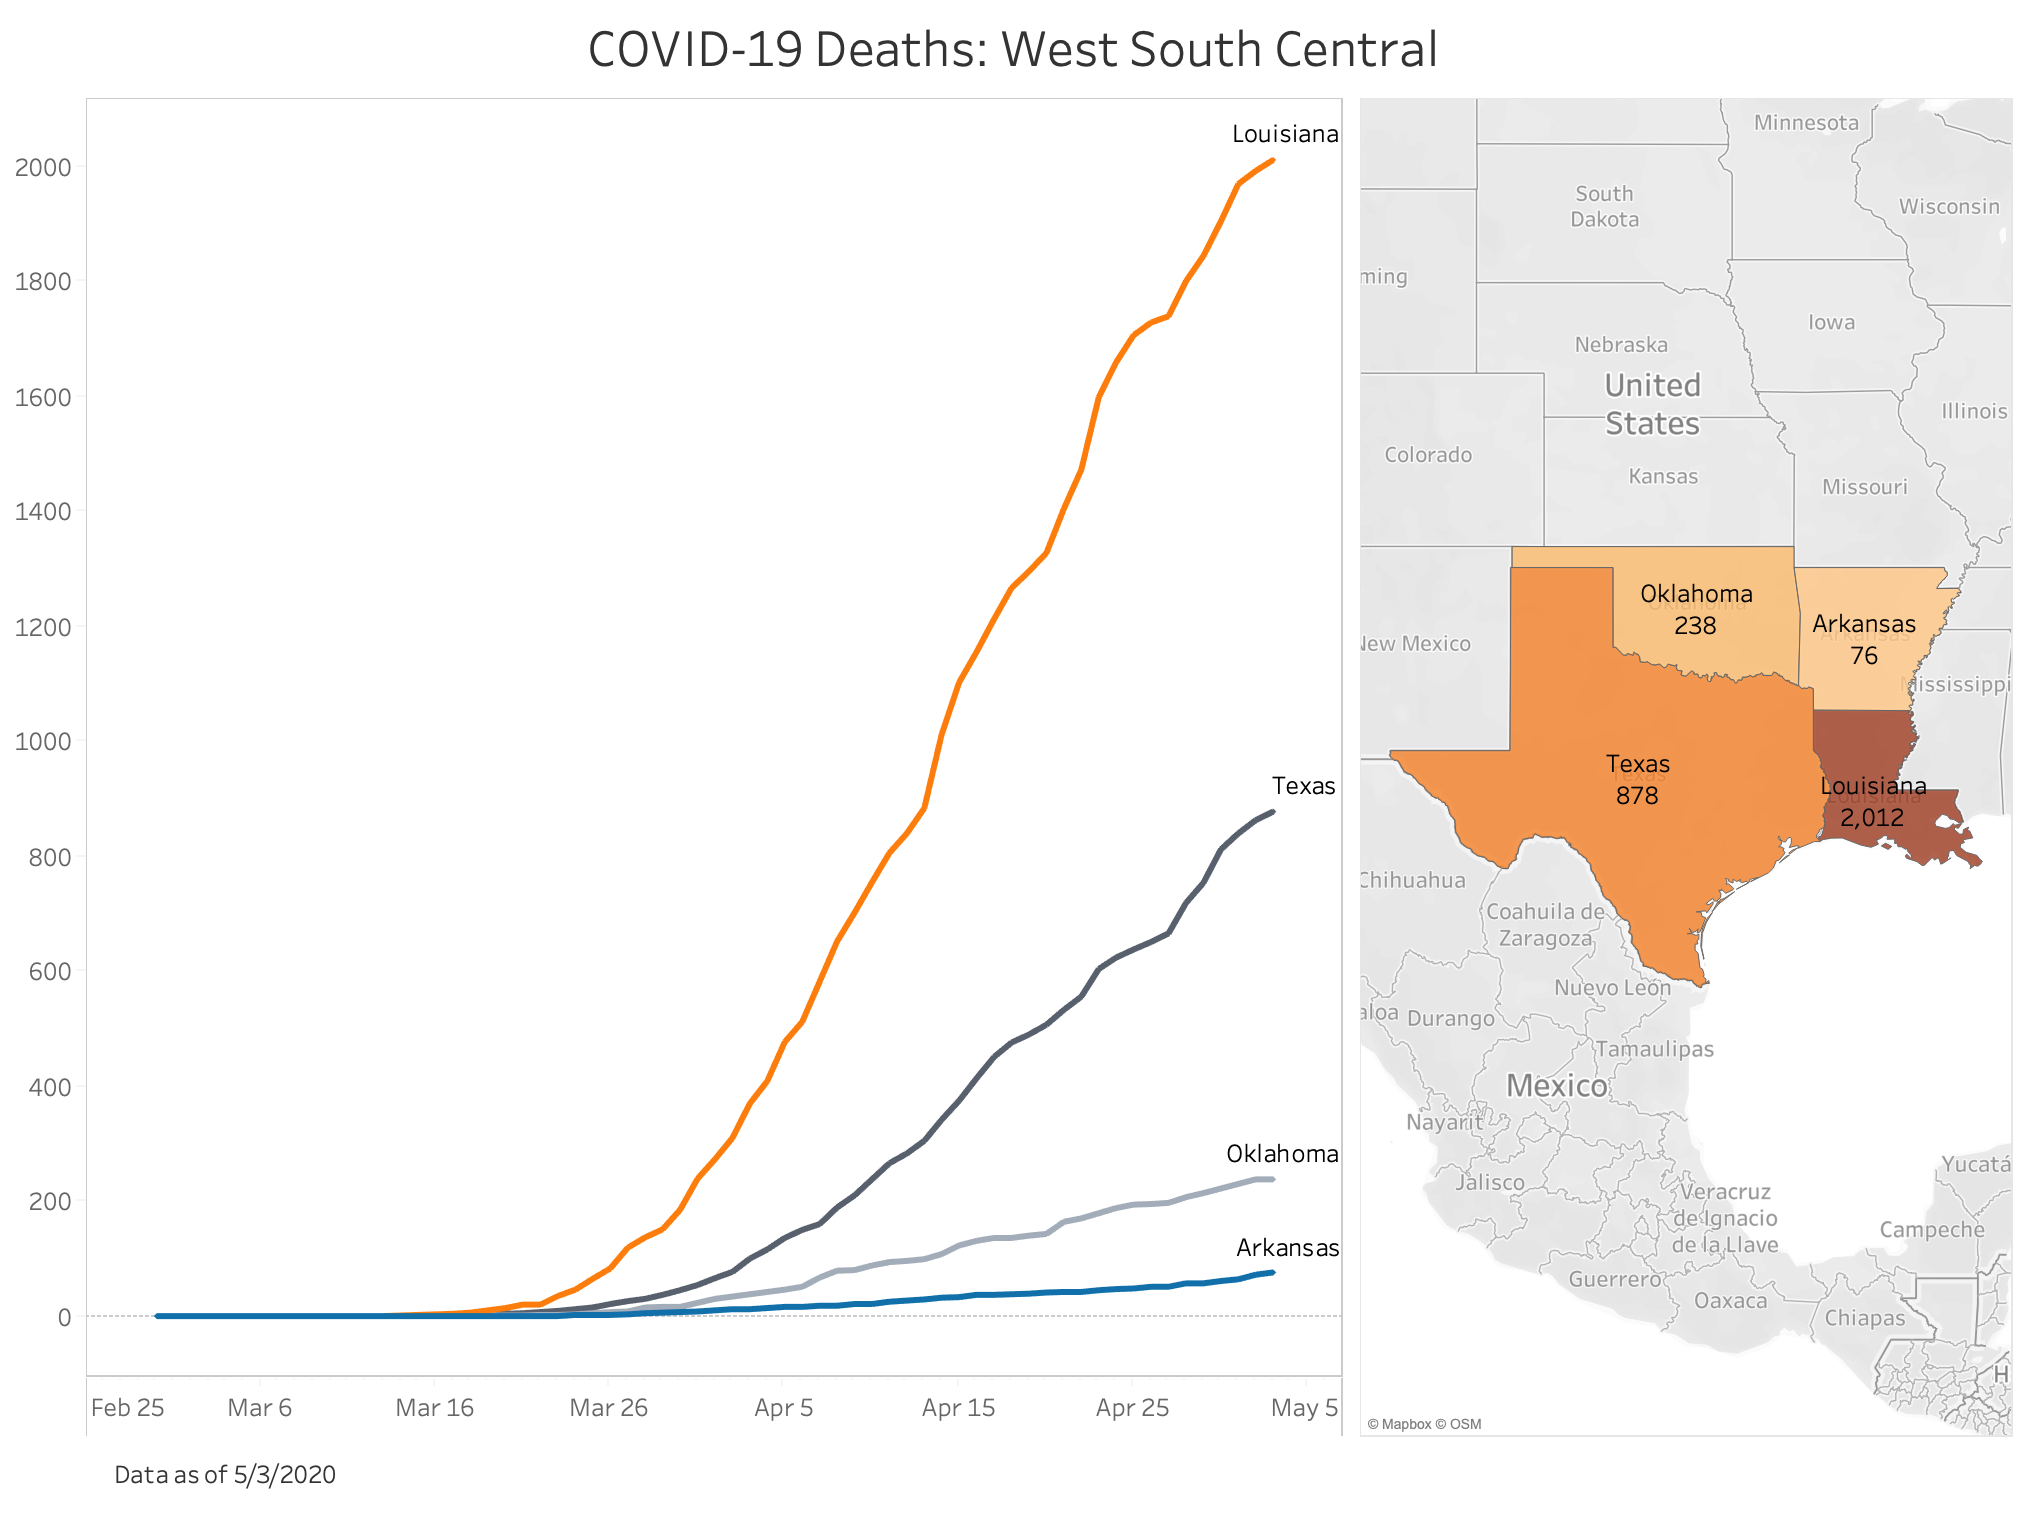
COVID-19 Deaths in the Contiguous United States
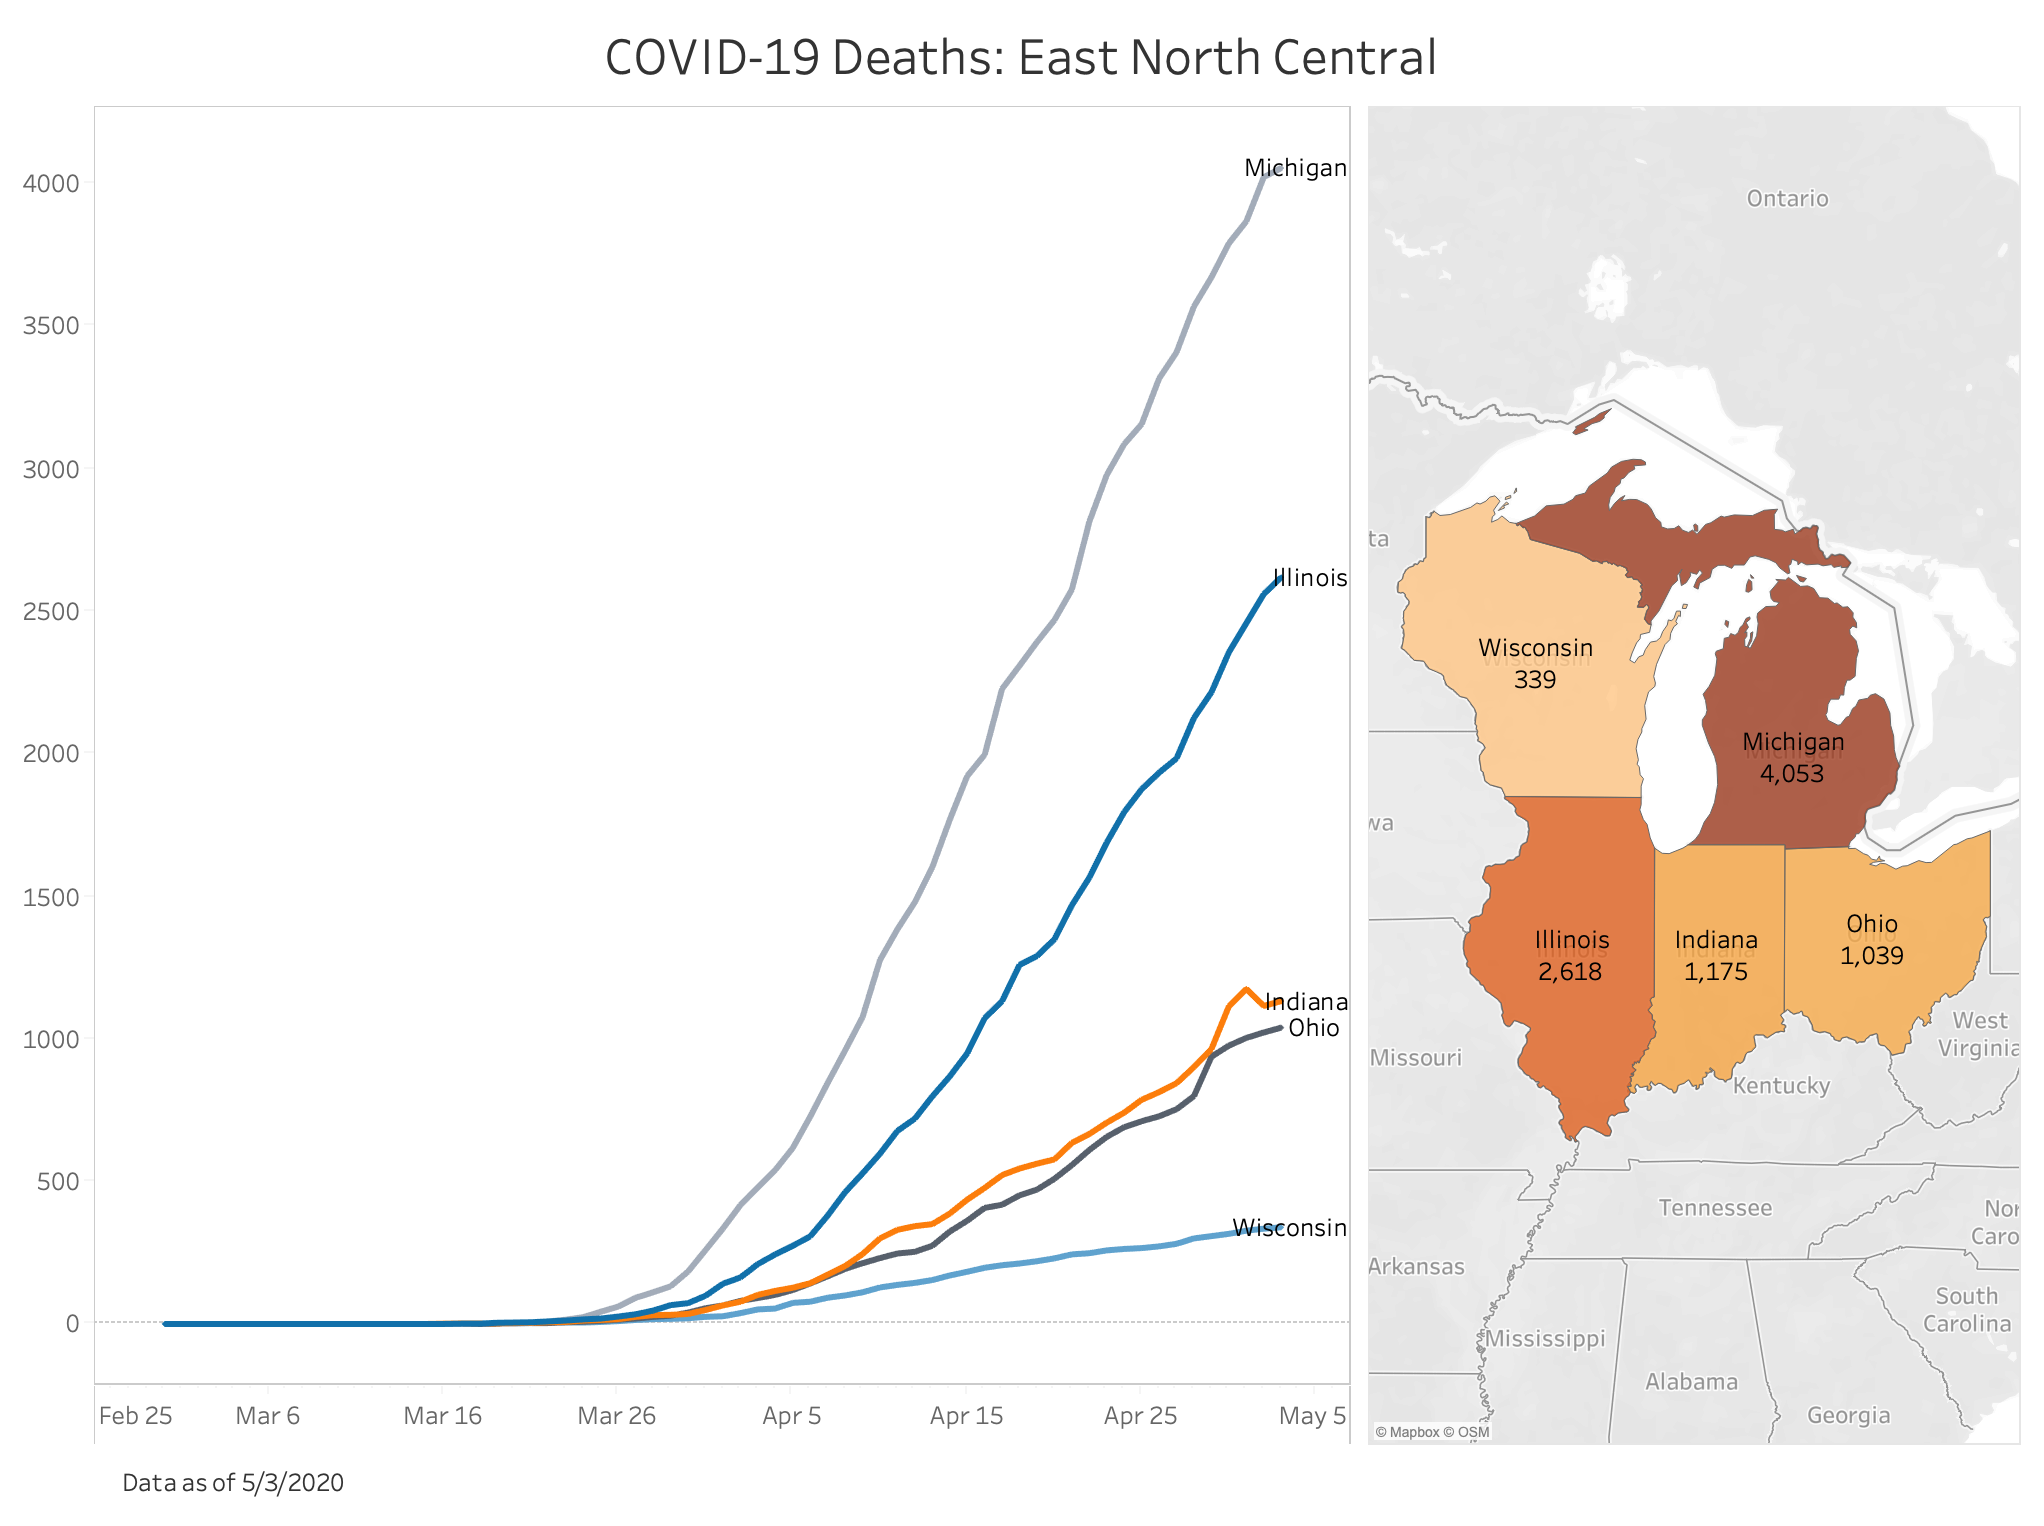
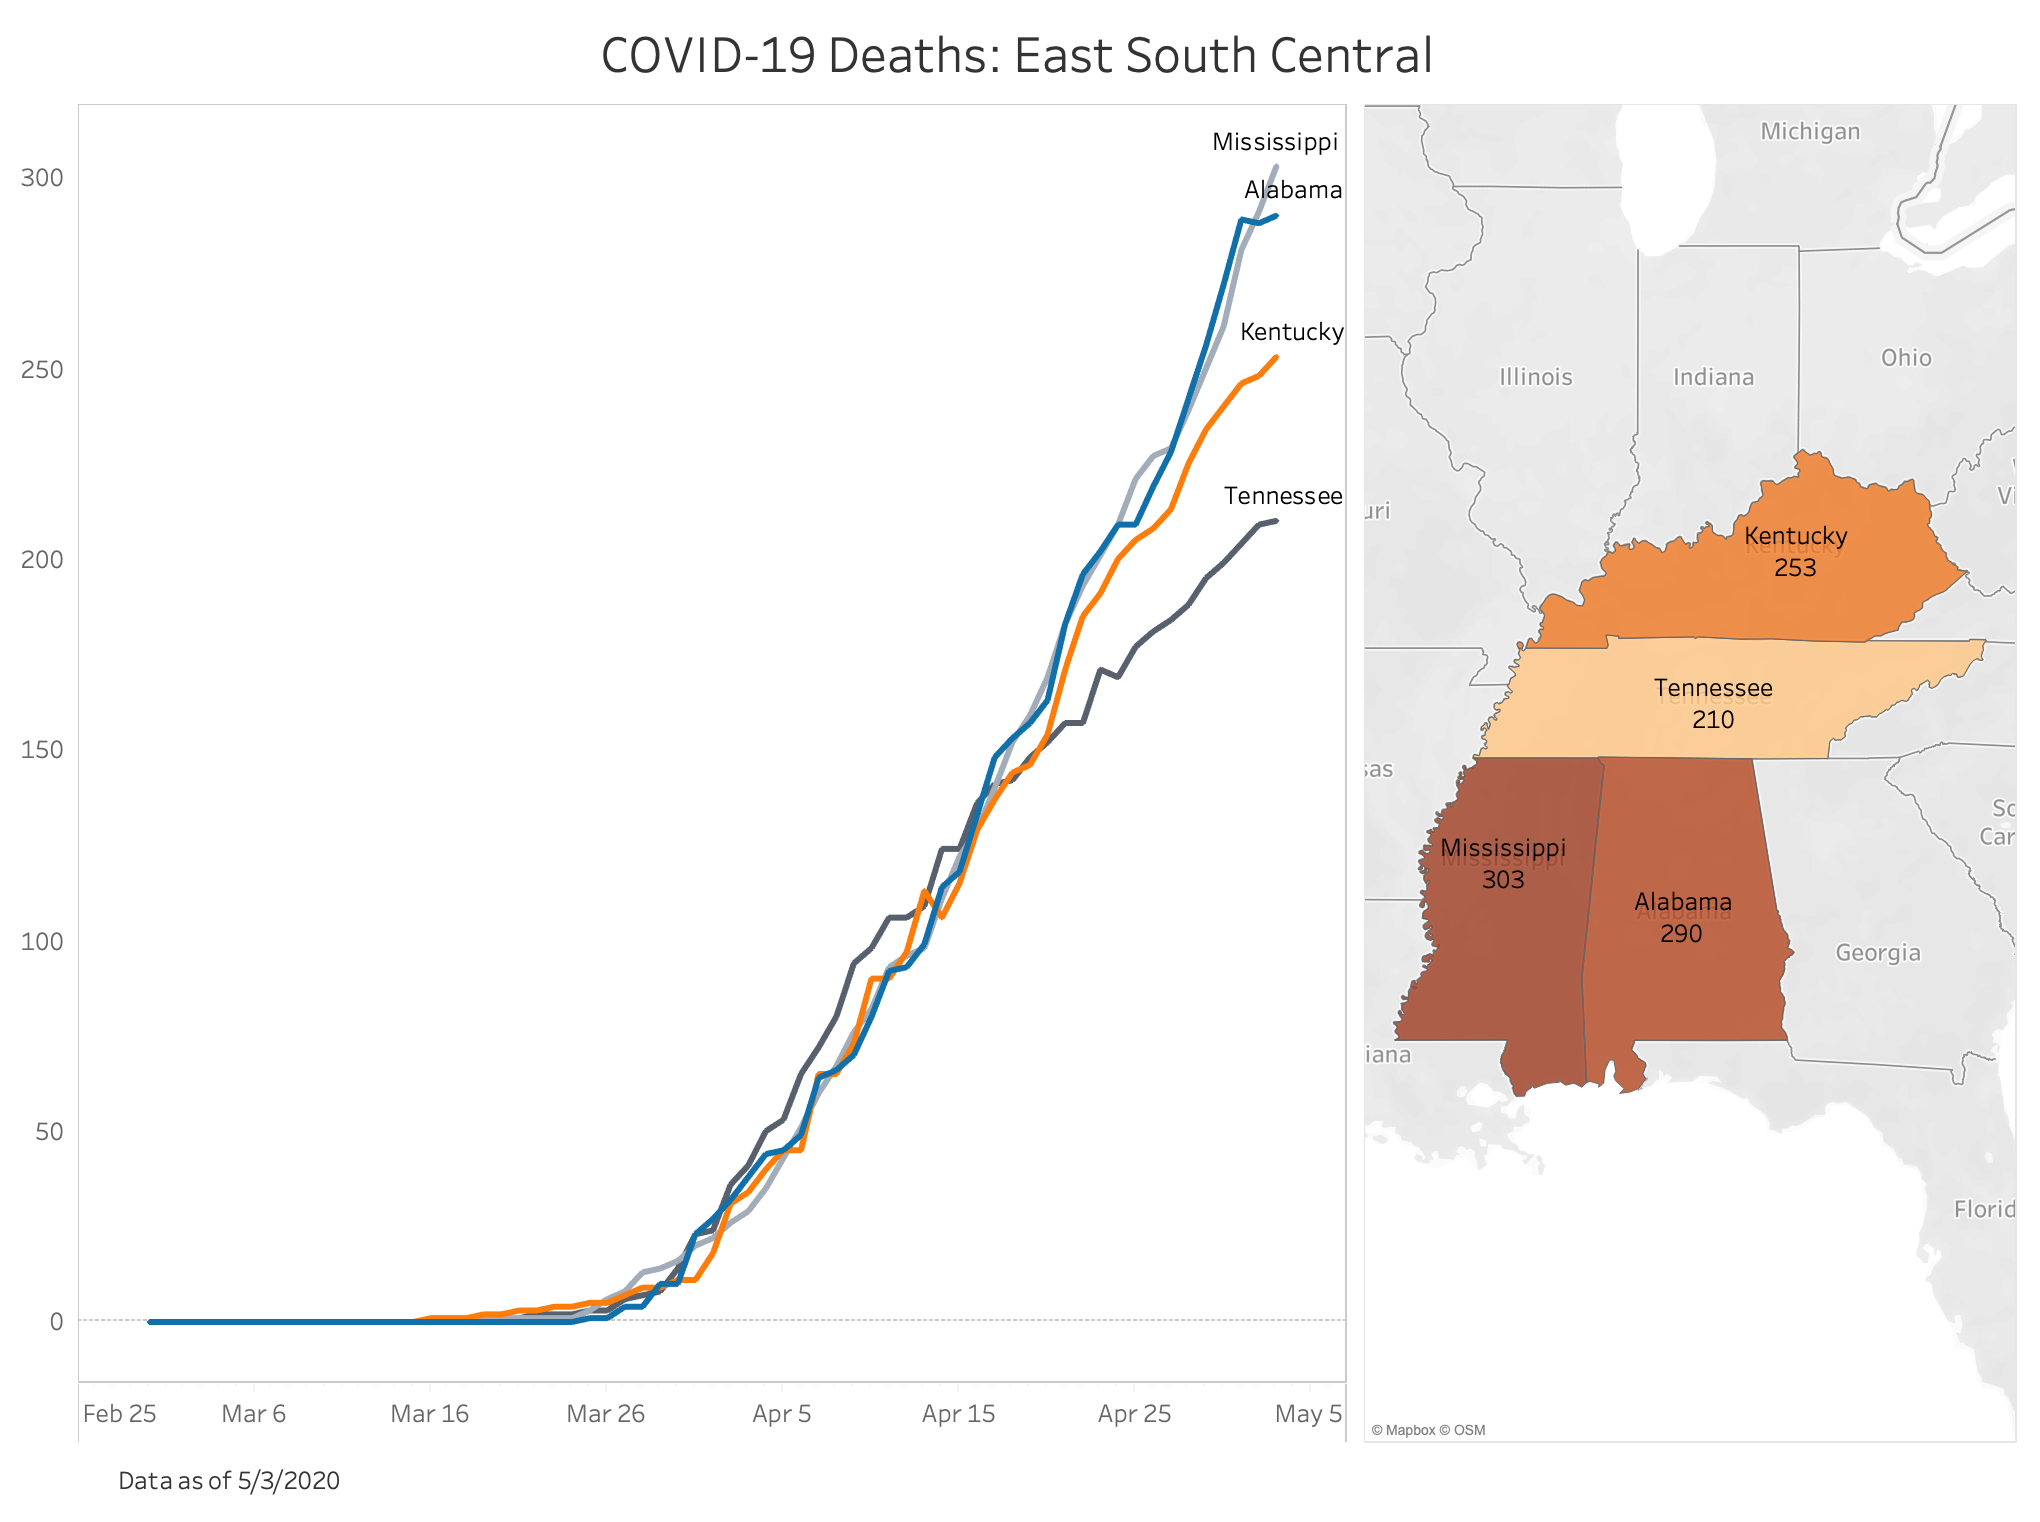
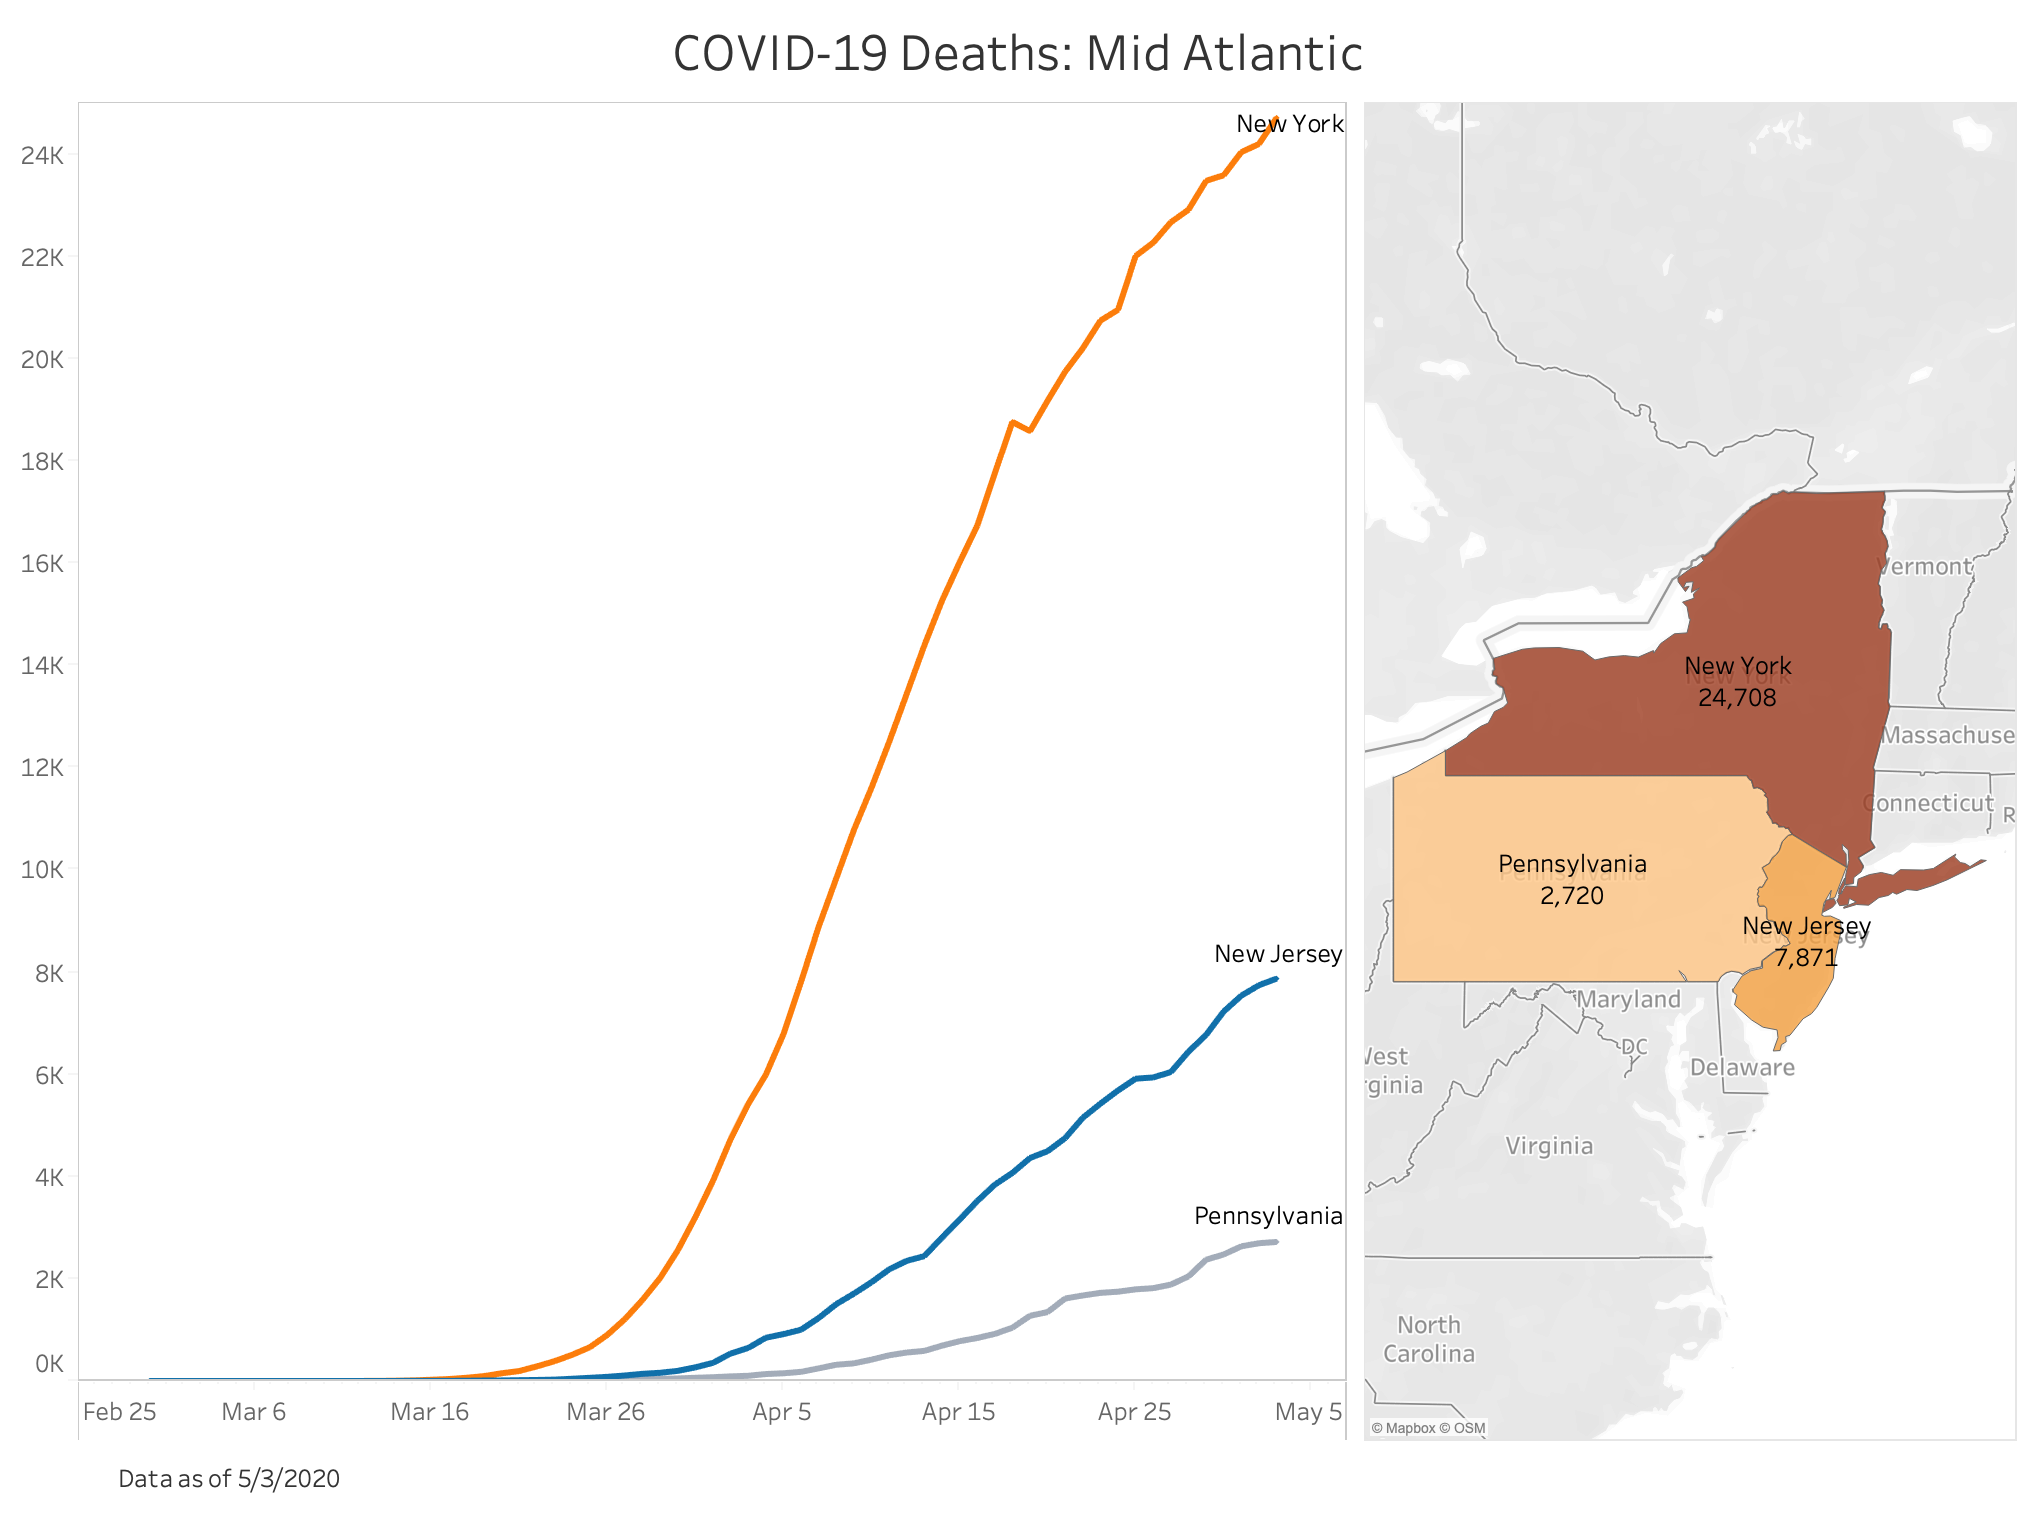
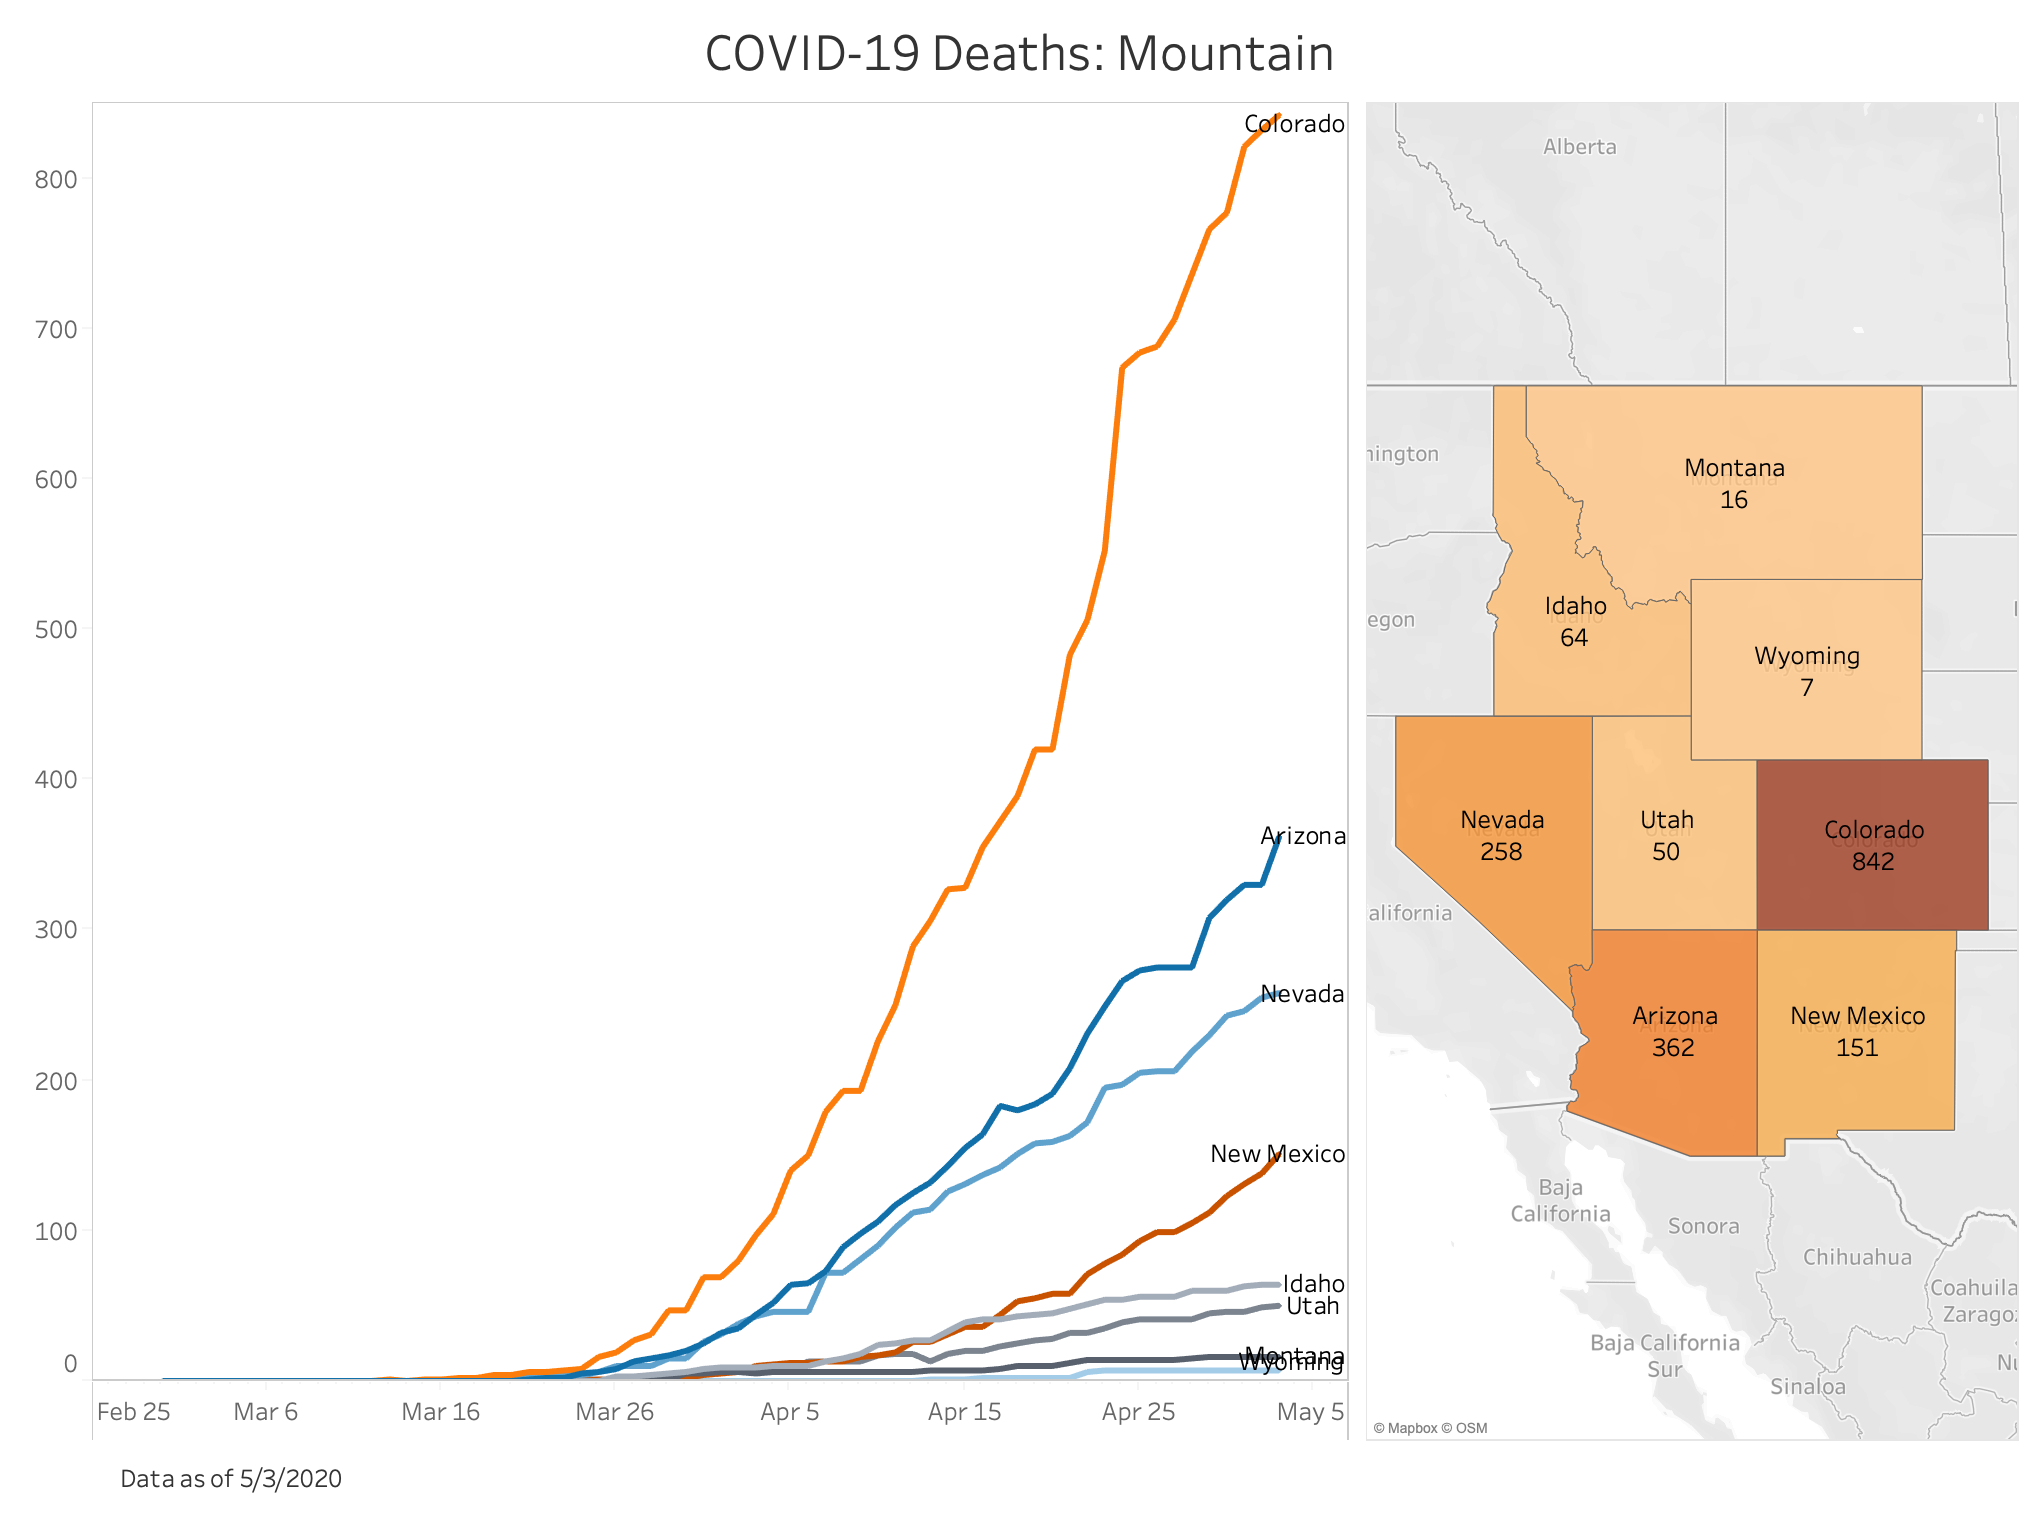
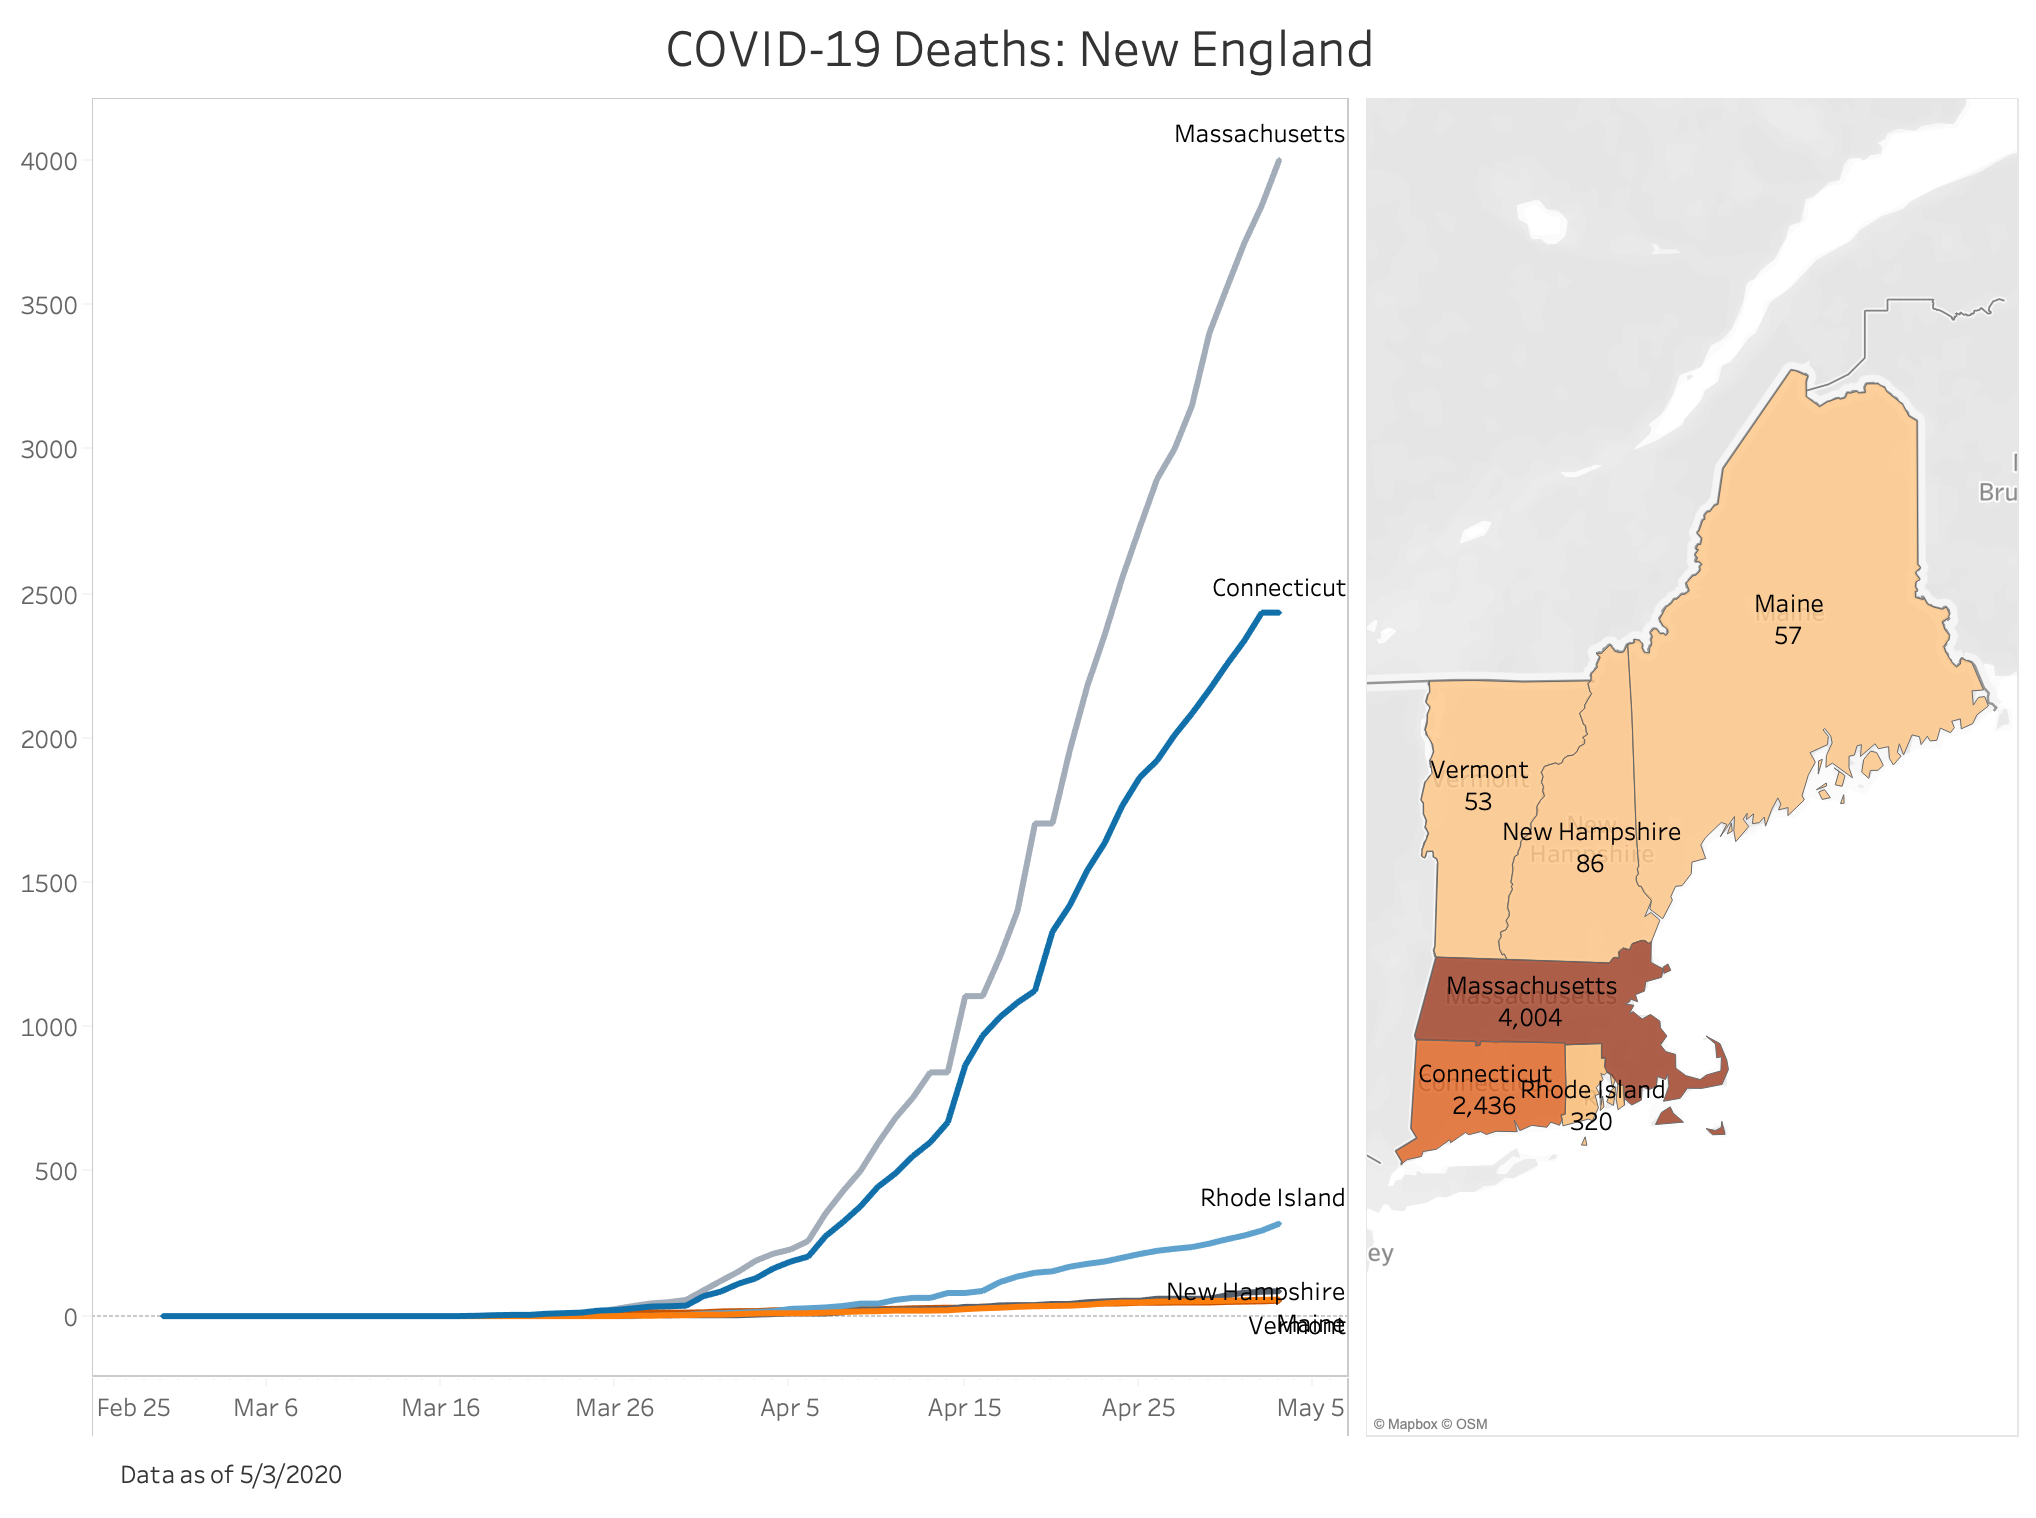
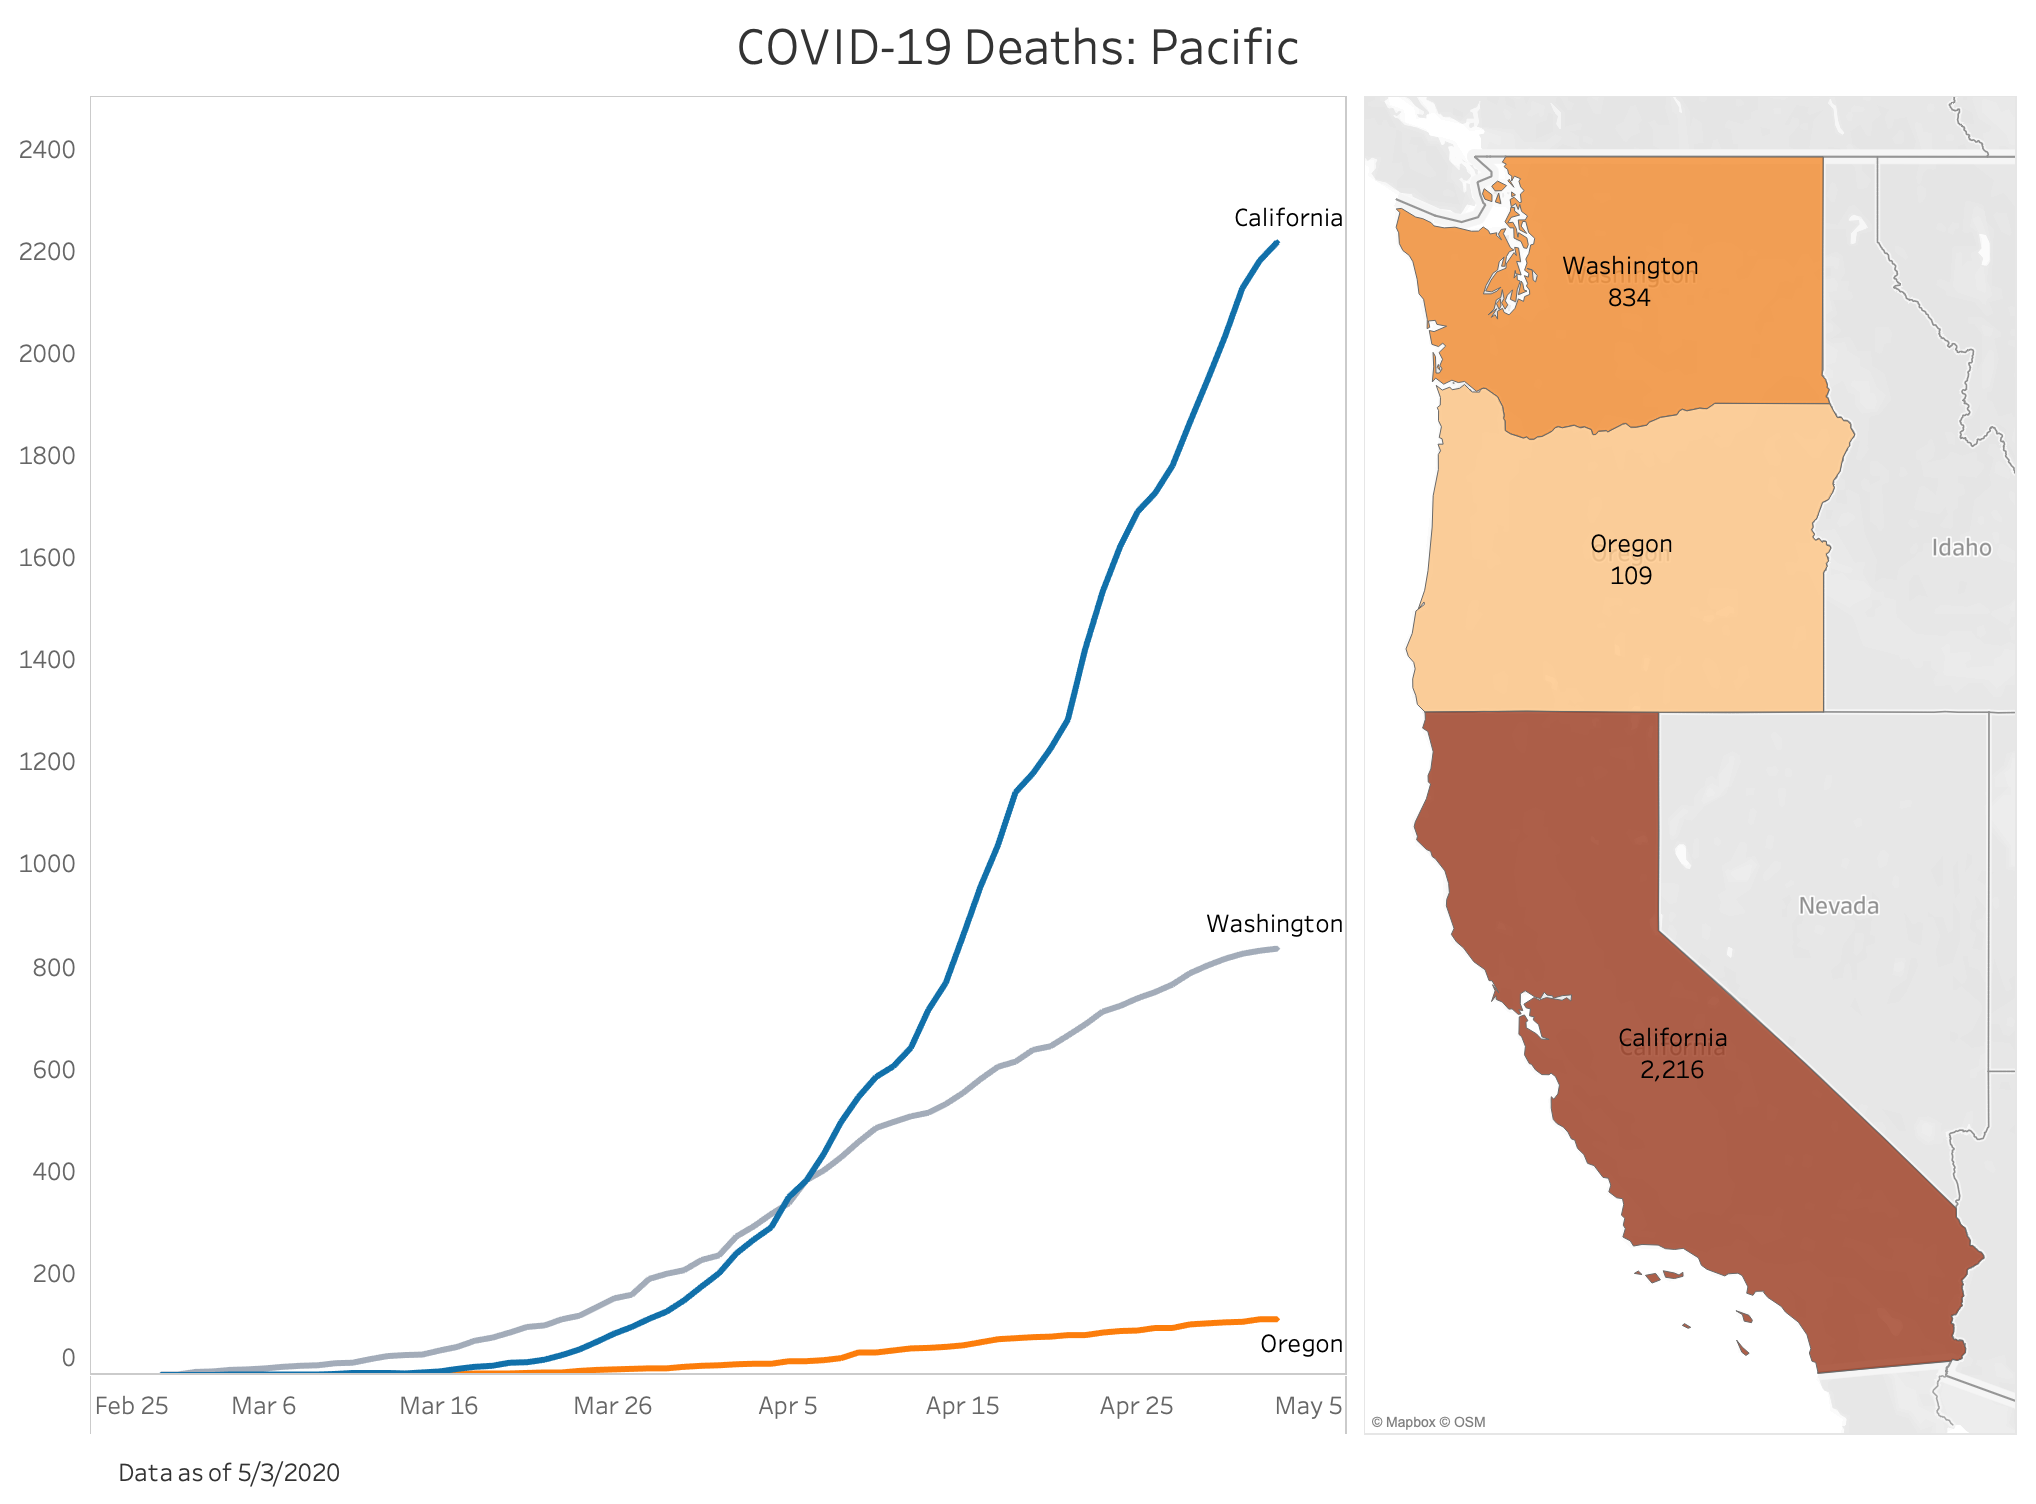
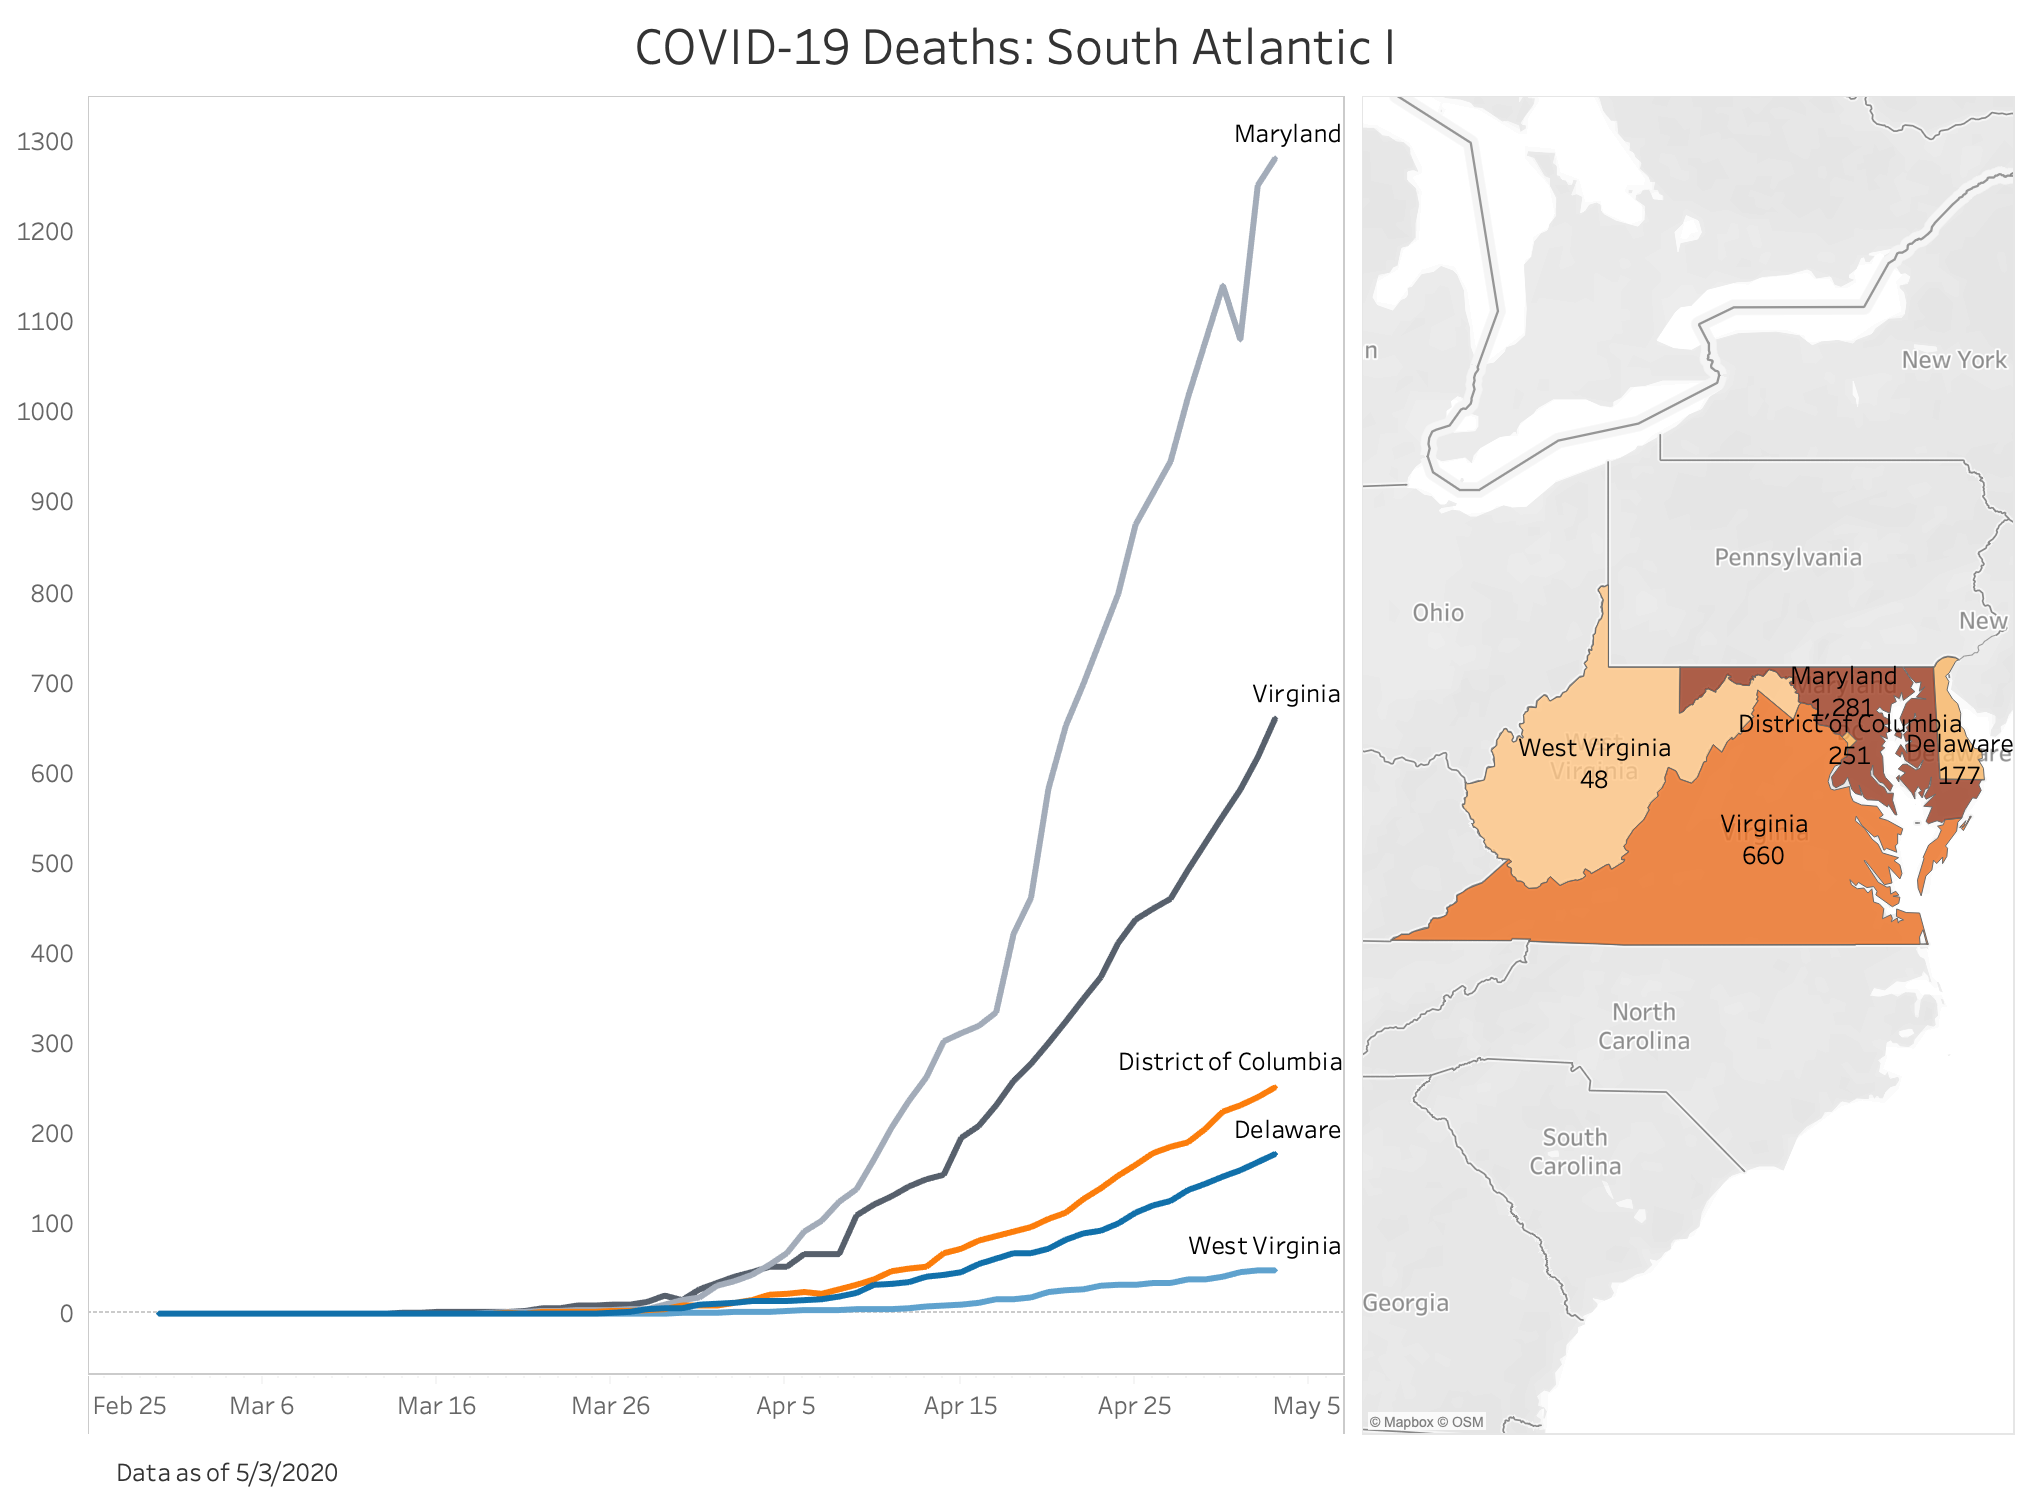
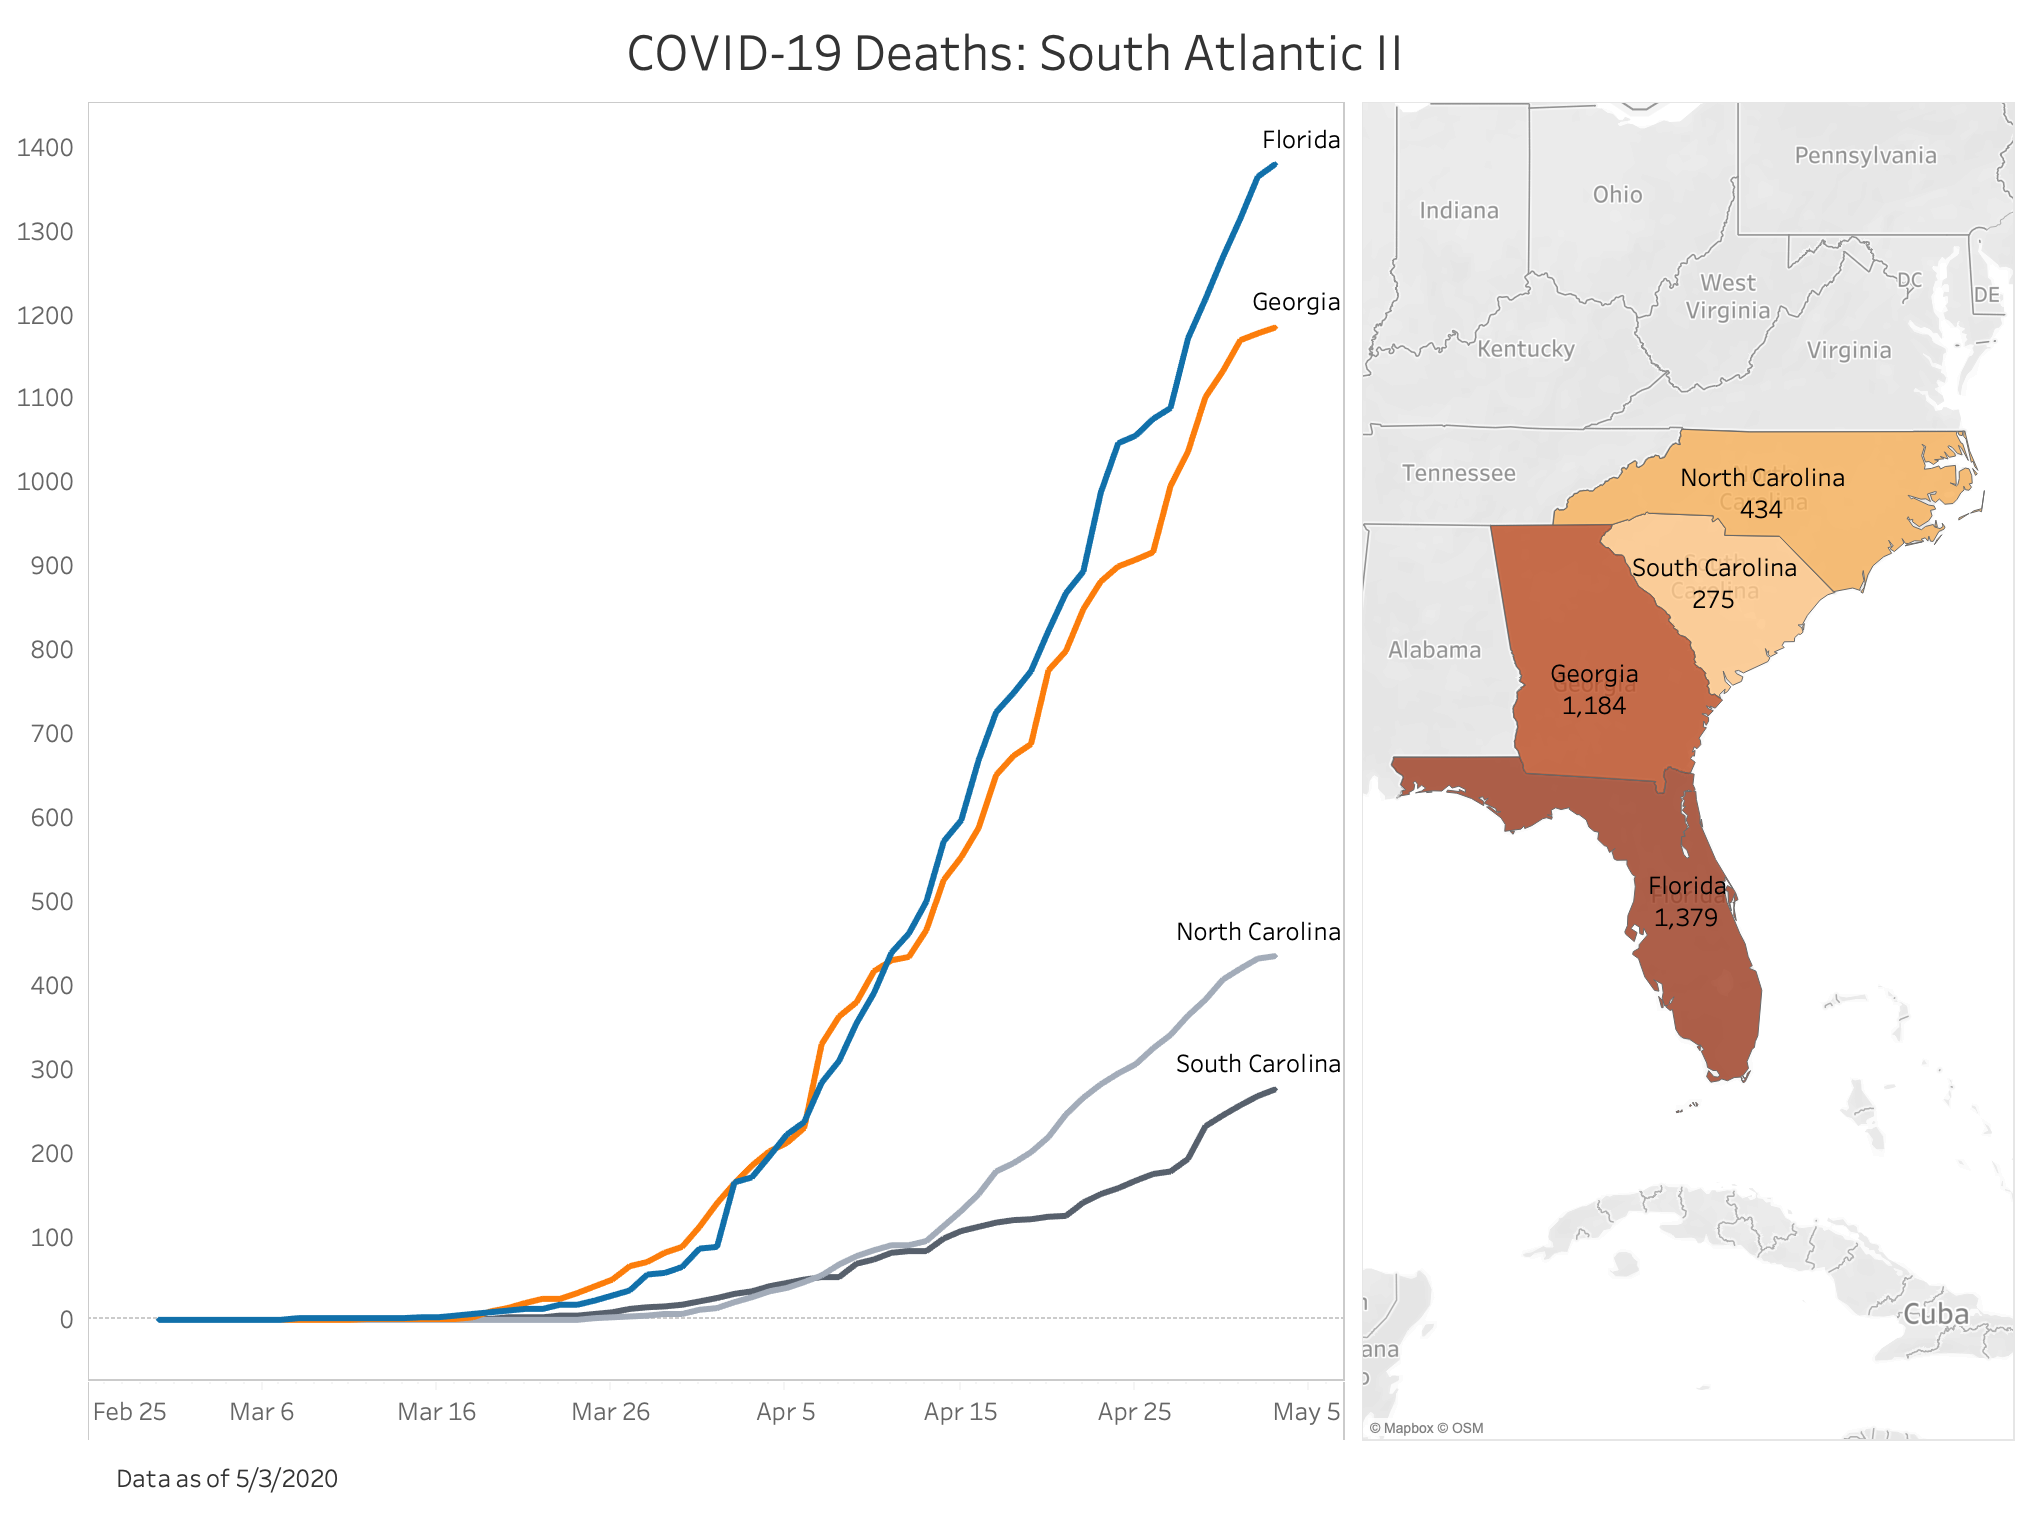
Here are some visualizations using the data from my previous post on Tidy Data. I used Tableau to show deaths over time due to COVID-19 for the Contiguous United States including Washington D.C.
The data is of 05/03/2020 and is sourced from the Johns Hopkins University Center for Systems Science and Engineering (repo available here).
Data is grouped largely by Census Bureau-designated regions and divisions. Please note that I’ve further divided up the South Atlantic divisions for display purposes.
For any questions, feel free to email me at dennis.y.hong@gmail.com