Seaborn: A Swarmplot of Formula 1 Pit Times in 2019
Below is a plot of all Formula 1 pit times for 2019 represented as a swarmplot using Seaborn, a popular higher-level visualization library for Python.
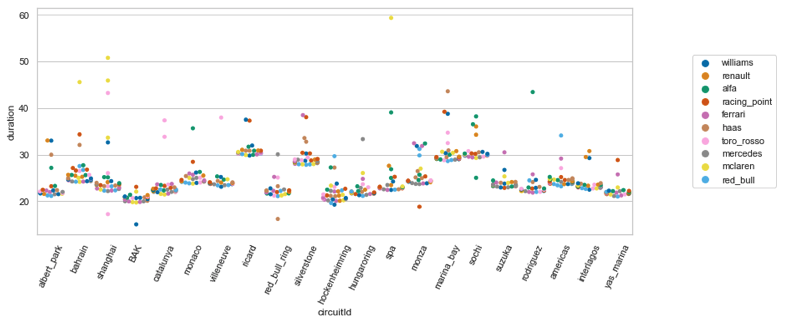
Data was sourced from the Formula 1 API provided by Ergast and processed into Tidy Data using pandas in Python. For the full Jupyter Notebook with complete examples please refer here.